Sending Metrics from Storm to Graphite
So you got your first distributed Storm cluster installed and have your first topologies up and running. Great! Now you want to integrate your Storm applications with your monitoring systems and begin tracking application-level metrics from your topologies. In this article I show you how to integrate Storm with the popular Graphite monitoring system. This, combined with the Storm UI, will provide you with actionable information to tune the performance of your topologies and also help you to track key business as well as technical metrics.
- Background: What is Graphite?
- What we want to do
- Desired outcome: graphs and dashboards
- Versions
- A Graphite primer
- High-level approach
- Integrating Storm with Graphite
- Summary
- Appendix
Background: What is Graphite?
Quoting from Graphite’s documentation, Graphite does two things:
- Store numeric time-series data
- Generate and render graphs of this data on demand
What Graphite does not do is collect the actual input data for you, i.e. your system or application metrics. The purpose of this blog post is to show how you can do this for your Storm applications.
What we want to do
Spatial granularity of metrics
For the context of this post we want to use Graphite to track the number of received tuples of an example bolt per node in the Storm cluster. This allows us, say, to pinpoint a potential topology bottleneck to specific machines in the Storm cluster – and this is particularly powerful if we already track system metrics (CPU load, memory usage, network traffic and such) in Graphite because then you can correlate system and application level metrics.
Keep in mind that in Storm multiple instances of a bolt may run on a given node, and its instances may also run on many
different nodes. Our challenge will be to configure Storm and Graphite in a way that we are able to correctly collect
and aggregate all individual values reported by those many instances of the bolt. Also, the total value of these
per-host tuple counts should ideally match the bolt’s Executed value – which means the number of executed tuples of
a bolt (i.e. across all instances of the bolt in a topology) – in the Storm UI.
We will add Graphite support to our Java-based Storm topology by using Coda Hale/Yammer’s Metrics library for Java, which directly supports reporting metrics to Graphite.
We will track the number of received tuples of our example bolt through the following metrics, where HOSTNAME is a
placeholder for the hostname of a particular Storm node (e.g. storm-node01):
production.apps.graphitedemo.HOSTNAME.tuples.received.countproduction.apps.graphitedemo.HOSTNAME.tuples.received.m1_rate– 1-minute rateproduction.apps.graphitedemo.HOSTNAME.tuples.received.m5_rate– 5-minute rateproduction.apps.graphitedemo.HOSTNAME.tuples.received.m15_rate– 15-minute rateproduction.apps.graphitedemo.HOSTNAME.tuples.received.mean_rate– average rate/sec
Here, the prefix of the metric namespace production.apps.graphitedemo.HOSTNAME.tuples.received is defined by us.
Splitting up this “high-level” metric into a count metric and four rate metrics – m{1,5,15}_rate and mean_rate –
is automatically done by the Metrics Java library.
Temporal granularity of metrics
Because Storm is a real-time analytics platform we want to use a shorter time window for metrics updates than Graphite’s default, which is one minute. In our case we will report metrics data every 10 seconds (the finest granularity that Graphite supports is one second).
Assumptions
- We are using a single Graphite server called
your.graphite.server.com. - The
carbon-cacheandcarbon-aggregatordaemons of Graphite are both running on the Graphite server machine, i.e.carbon-aggregatorwill send its updates to thecarbon-cachedaemon running at127.0.0.1. Also, our Storm topology will send all its metrics to this Graphite server.
Thankfully the specifics of the Storm cluster such as hostnames of nodes do not matter. So the approach described here should work nicely with your existing Storm cluster.
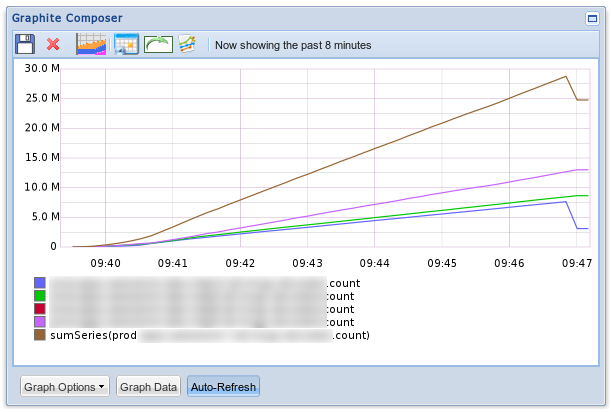
Desired outcome: graphs and dashboards
The desired end result are graphs and dashboards similar to the following Graphite screenshot:
Versions
The instructions in this article have been tested on RHEL/CentOS 6 with the following software versions:
- Storm 0.9.0-rc2
- Graphite 0.9.12 (stock version available in EPEL for RHEL6)
- Metrics 3.0.1
- Oracle JDK 6
Note that I will not cover the installation of Storm or Graphite in this post.
A Graphite primer
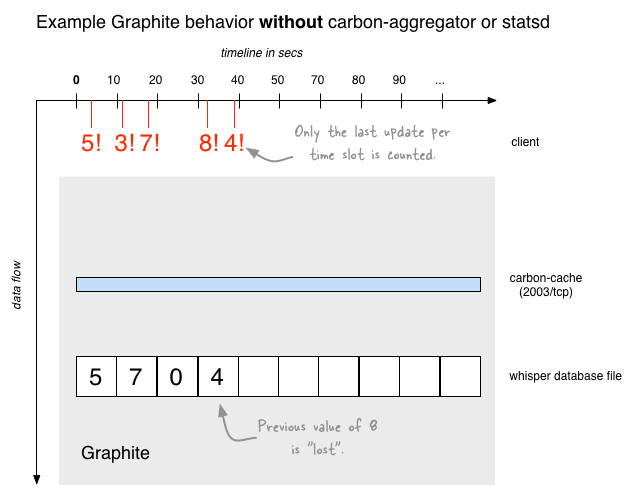
Understanding how Graphite handles incoming data
One pitfall for Graphite beginners is the default behavior of Graphite to discard all but the last update message
received during a given time slot (the default size of a time slot for metrics in Graphite is 60 seconds). For example,
if we are sending the metric values 5 and 4 during the same time slot then Graphite will first store a value of 5,
and as soon as the value 4 arrives it will overwrite the stored value from 5 to 4 (but not sum it up to 9).
The following diagram shows what happens if Graphite receives multiple updates during the same time slot when we are NOT
using an aggregator such as carbon-aggregator or
statsd in between. In this example we use a time slot of 10 seconds for the metric.
Note again that in this scenario you might see, for instance, “flapping” values for the second time slot (window of
seconds 10 to 20) depending on when you would query Graphite: If you queried Graphite at second 15 for the 10-20 time
slot, you would receive a return value of 3, and if you queried only a few seconds later you would start receiving the
final value of 7 ( the latter of which would then never change anymore).
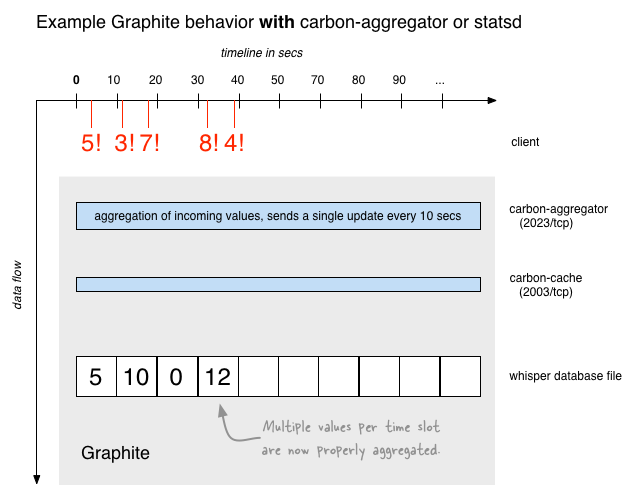
In most situations losing all but the last update of a given time slot is not what you want. The next diagram shows how aggregators solve the “only the last update counts” problem. A nice property of aggregators is that they are transparent to the client who can continue to send updates as soon as it sees fit – the aggregators will ensure that Graphite will only see a single, merged update message for the time slot.
Implications of Storm’s execution model
In the case of Storm you implement a bolt (or spout) as a single class, e.g. by extending BaseBasicBolt. So following
the User Manual of the Metrics library seems to be a straight-forward way to add
Graphite support to your Storm bolts. However you must be aware of how Storm will actually execute your topology
behind the scenes – see my earlier post on
Understanding the Parallelism of a Storm Topology:
- In Storm each bolt typically runs in the form of many bolt instances in a single worker process, and thus you have many bolt instances in a single JVM.
- In Storm there are typically many such workers (and thus JVMs) per machine, so you end up with many instances of the same bolt running across many workers/JVMs on a particular machine.
- On top of that a bolt’s instances will also be spread across many different machines in the Storm cluster, so in total you will typically have many bolt instances running in many JVMs across many Storm nodes.
Our challenge to integrate Storm with Graphite can thus be stated as: How can we ensure that we are reporting metrics from our Storm topology to Graphite in such way that a) we are counting tuples correctly across all bolt instances, and b) the many metric update messages are not canceling each other out? In other words, how can we keep Storm’s highly distributed nature in check and make it play nice with Graphite?
High-level approach
Overview of the approach described in this post
Here is an overview of the approach we will be using:
- Each instance of our example Storm bolt gets its own (Java) instance of Meter. This ensures that each bolt instance tracks its count of received tuples separately from any other bolt instance.
- Also, each bolt instance will get its own instance of GraphiteReporter to ensures that each bolt instance sends only a single metrics update every 10 seconds, which is the desired temporal granularity for our monitoring setup.
- All bolt instances on a given Storm node report their metrics under the node’s hostname. For instance, bolt
instances on the machine
storm-node01.example.comwill report their metrics under the namespaceproduction.apps.graphitedemo.storm-node01.tuples.received.*. - Metrics are being sent to a
carbon-aggregatorinstance running atyour.graphite.server.com:2023/tcp. Thecarbon-aggregatorensures that all the individual metrics updates (from bolt instances) of a particular Storm node are aggregated into a single, per-host metric update. These per-host metric updates are then forwarded to thecarbon-cacheinstance, which will store the metric data in the corresponding Whisper database files.
Other approaches (not used)
Another strategy is to install an aggregator intermediary (such as statsd) on each machine in the Storm cluster. Instances of a bolt on the same machine would be sending their individual updates to this per-host aggregator daemon, which in turn would send a single, per-host update message to Graphite. I am sure this approach would have worked but I decided to not go down this path. It would have increased the deployment complexity because now we’d have one more software package to understand, support and manage per machine.
The final setup described in this post achieves what we want by using GraphiteReporter in our Storm code in a way
that is compatible with Graphite’s built-in daemons without needing any additional software such as statsd.
On a completely different note, Storm 0.9 now also comes with its own metrics system, which I do not cover here.
This new metrics feature of Storm allows you to collect arbitrarily custom metrics over fixed time windows. Those
metrics are exported to a metrics stream that you can consume by implementing
IMetricsConsumer
and configured with
Config – see the
various *_METRICS_* settings. Then you need to use TopologyContext#registerMetric() to register new metrics.
Integrating Storm with Graphite
Configuring Graphite
I will only cover the key settings of Graphite for the context of this article, which are the settings related to
carbon-cache and carbon-aggregator. Those settings must match the settings in your Storm code. Matching
settings between Storm and Graphite is critical – if they don’t you will end up with junk metric data.
carbon-cache configuration
First we must add a [production_apps] section (the name itself is not relevant, it should only be descriptive) to
/etc/carbon/storage-schemas.conf. This controls at which granularity Graphite will store incoming metrics that we are
sending from our Storm topology. Notably these storage schema settings control:
- The minimum temporal granularity for the “raw” incoming metric updates of a given metric namespace: In our case, for
instance, we want Graphite to track metrics at a raw granularity of 10 seconds for the first two days. We configure
this via
10s:2d. This minimum granularity (10 seconds) must match the report interval we use in our Storm code. - How Graphite aggregates older metric values that have already been stored in its Whisper database files:
In our case we tell Graphite to aggregate any values older than two days into 5-minute buckets that we want to keep
for one year, hence
5m:1y. This setting (5 minutes) is independent from our Storm code.
# File: /etc/carbon/storage-schemas.conf

# Schema definitions for whisper files. Entries are scanned in order, and first match wins.
[carbon]
pattern = ^carbon\.
retentions = 60:90d

[production_apps]
pattern = ^production\.apps\.
retentions = 10s:2d,5m:1y

[default_1min_for_1day]
pattern = .*
retentions = 60s:1d
Next we must tell Graphite which aggregation method – e.g. sum or average – it should use to perform storage
aggregation of our metrics. For count-type metrics, for instance, we want to use sum and for rate-type metrics we
want to use average. By adding the following lines to /etc/carbon/storage-aggregation.conf we ensure that Graphite
correctly aggregates the default metrics sent by Metrics’ GraphiteReporter – count, m1_rate, m5_rate, m15_rate
and mean_rate – once two days have passed.
# File: /etc/carbon/storage-aggregation.conf

[min]
pattern = \.min$
xFilesFactor = 0.1
aggregationMethod = min

[max]
pattern = \.max$
xFilesFactor = 0.1
aggregationMethod = max

[sum]
pattern = \.count$
xFilesFactor = 0
aggregationMethod = sum

[m1_rate]
pattern = \.m1_rate$
xFilesFactor = 0
aggregationMethod = average

[m5_rate]
pattern = \.m5_rate$
xFilesFactor = 0
aggregationMethod = average

[m15_rate]
pattern = \.m15_rate$
xFilesFactor = 0
aggregationMethod = average

[default_average]
pattern = .*
xFilesFactor = 0.3
aggregationMethod = average
Lastly, make sure that the carbon-cache daemon is actually enabled in your /etc/carbon/carbon.conf and configured to
receive incoming data on its LINE_RECEIVER_PORT at 2003/tcp and also (!) on its PICKLE_RECEIVER_PORT at
2004/tcp. The latter port is used by carbon-aggregator, which we will configure in the next section.
Example configuration snippet:
# File: /etc/carbon/carbon.conf
# ...snipp...

[cache]
LINE_RECEIVER_INTERFACE = 0.0.0.0
LINE_RECEIVER_PORT = 2003
PICKLE_RECEIVER_INTERFACE = 0.0.0.0
PICKLE_RECEIVER_PORT = 2004

# ...snipp...
Don’t forget to restart carbon-cache after changing its configuration:
$ sudo service carbon-cache restart
carbon-aggregator configuration
The last Graphite configuration we must perform is to ensure that we can pre-aggregrate the number of reported
tuples.received values across all bolt instances that run on a particular Storm node.
To perform this per-host aggregation on the fly we must add the following lines to /etc/carbon/aggregation-rules.conf.
With those settings whenever we are sending a metric such as
production.apps.graphitedemo.storm-node01.tuples.received.count from any bolt instance running on storm-node01 to
Graphite (more correctly, its carbon-aggregator daemon), it will aggregate (here: sum) all such update messages for
storm-node01 into a single, aggregated update message every 10 seconds for that server.
# File: /etc/carbon/aggregation-rules.conf
<env>.apps.<app>.<server>.all.tuples.received.count (10) = sum <env>.apps.<app>.<server>.tuples.received.count
<env>.apps.<app>.<server>.all.tuples.received.m1_rate (10) = sum <env>.apps.<app>.<server>.tuples.received.m1_rate
<env>.apps.<app>.<server>.all.tuples.received.m5_rate (10) = sum <env>.apps.<app>.<server>.tuples.received.m5_rate
<env>.apps.<app>.<server>.all.tuples.received.m15_rate (10) = sum <env>.apps.<app>.<server>.tuples.received.m15_rate
<env>.apps.<app>.<server>.all.tuples.received.mean_rate (10) = sum <env>.apps.<app>.<server>.tuples.received.mean_rate
Lastly, make sure that the carbon-aggregator daemon is actually enabled in your /etc/carbon/carbon.conf and
configured to receive incoming data on its LINE_RECEIVER_PORT at 2023/tcp. Also, make sure it sends its aggregates
to the PICKLE_RECEIVER_PORT of carbon-cache (port 2004/tcp). See the [aggregator] section.
Example configuration snippet:
# File: /etc/carbon/carbon.conf
# ...snipp...

[aggregator]
LINE_RECEIVER_INTERFACE = 0.0.0.0
LINE_RECEIVER_PORT = 2023
PICKLE_RECEIVER_INTERFACE = 0.0.0.0
PICKLE_RECEIVER_PORT = 2024
DESTINATIONS = 127.0.0.1:2004  # <<< this points to the carbon-cache pickle port

# ...snipp...
Don’t forget to restart carbon-aggregator after changing its configuration:
$ sudo service carbon-aggregator restart
Other important Graphite settings
You may also want to check the values of the following Carbon settings in /etc/carbon/carbon.conf, particularly if you
are sending a lot of different metrics (= high number of metrics such as my.foo and my.bar) and/or a lot of metric
update messages per second (= high number of incoming metric updates for my.foo).
Whether or not you need to tune those settings depends on your specific use case. As a rule of thumb: The more Storm nodes you have, the higher the topology’s parallelism and the higher your data volume, the more likely you will need to optimize those settings. If you are not sure, leave them at their defaults and revisit later.
# File: /etc/carbon/carbon.conf

[cache]
# Limit the size of the cache to avoid swapping or becoming CPU bound.
# Sorts and serving cache queries gets more expensive as the cache grows.
# Use the value "inf" (infinity) for an unlimited cache size.
MAX_CACHE_SIZE = inf

# Limits the number of whisper update_many() calls per second, which effectively
# means the number of write requests sent to the disk. This is intended to
# prevent over-utilizing the disk and thus starving the rest of the system.
# When the rate of required updates exceeds this, then carbon's caching will
# take effect and increase the overall throughput accordingly.
MAX_UPDATES_PER_SECOND = 500

# Softly limits the number of whisper files that get created each minute.
# Setting this value low (like at 50) is a good way to ensure your graphite
# system will not be adversely impacted when a bunch of new metrics are
# sent to it. The trade off is that it will take much longer for those metrics'
# database files to all get created and thus longer until the data becomes usable.
# Setting this value high (like "inf" for infinity) will cause graphite to create
# the files quickly but at the risk of slowing I/O down considerably for a while.
MAX_CREATES_PER_MINUTE = 50

[aggregator]
# This is the maximum number of datapoints that can be queued up
# for a single destination. Once this limit is hit, we will
# stop accepting new data if USE_FLOW_CONTROL is True, otherwise
# we will drop any subsequently received datapoints.
MAX_QUEUE_SIZE = 10000

# Set this to False to drop datapoints when any send queue (sending datapoints
# to a downstream carbon daemon) hits MAX_QUEUE_SIZE. If this is True (the
# default) then sockets over which metrics are received will temporarily stop accepting
# data until the send queues fall below 80% MAX_QUEUE_SIZE.
USE_FLOW_CONTROL = True

# This defines the maximum "message size" between carbon daemons.
# You shouldn't need to tune this unless you really know what you're doing.
MAX_DATAPOINTS_PER_MESSAGE = 500

# This defines how many datapoints the aggregator remembers for
# each metric. Aggregation only happens for datapoints that fall in
# the past MAX_AGGREGATION_INTERVALS * intervalSize seconds.
MAX_AGGREGATION_INTERVALS = 5
Configuring your Storm code
Add the Metrics library to your Storm code project
The instructions below are for Gradle but it is straight-forward to adapt them to Maven if that’s your tool of choice.
Now that we have finished the Graphite setup we can turn our attention to augmenting our Storm code to work with
Graphite. Make sure build.gradle in your Storm code project looks similar to the following:
# File: build.gradle

buildscript {
  repositories {
    mavenCentral()
  }
  dependencies {
    // see https://github.com/musketyr/gradle-fatjar-plugin
    classpath 'eu.appsatori:gradle-fatjar-plugin:0.2-rc1'
  }
}

apply plugin: 'java'
apply plugin: 'fatjar'
// ...other plugins may follow here...

// We use JDK 6.
sourceCompatibility = 1.6
targetCompatibility = 1.6

group = 'com.miguno.storm.graphitedemo'
version = '0.1.0-SNAPSHOT'

repositories {
    mavenCentral()
    // required for Storm jars
    mavenRepo url: "http://clojars.org/repo"
}

dependencies {
  // Metrics library for reporting to Graphite
  compile 'com.codahale.metrics:metrics-core:3.0.1'
  compile 'com.codahale.metrics:metrics-annotation:3.0.1'
  compile 'com.codahale.metrics:metrics-graphite:3.0.1'

  // Storm
  compile 'storm:storm:0.9.0-rc2', {
    ext {
      // Storm puts its own jar files on the CLASSPATH of a running topology by itself,
      // and therefore does not want you to re-bundle Storm's class files with your
      // topology jar.
      fatJarExclude = true
    }
  }

  // ...other dependencies may follow here...
}

// ...other gradle settings may follow here...
You can then run the usual gradle commands to compile, test and package your code. Particularly, you can now run:
$ gradle clean fatJar
This command will create a fat jar (also called uber jar) of your Storm topology code, which will be stored under
build/libs/*.jar by default. You can use this jar file to submit your topology to Storm via the storm jar command.
See the section on how to
build a correct standalone jar file of your Storm code
in my Storm multi-node cluster tutorial for details.
Sending metrics from a Storm bolt to Graphite
In this section we will augment a Storm bolt (spouts will work just the same) to report our tuples.received metrics to
Graphite.
Our bolt, i.e. its instances, will send this metric under the Graphite namespace
production.apps.graphitedemo.HOSTNAME.tuples.received.* every 10 seconds to the carbon-aggregator daemon running at
your.graphite.server.com:2023/tcp.
The key points of the code below are, firstly, the use of a transient private field for the Meter instance. If
you do not make the field transient Storm will throw a NotSerializableException during runtime. This is because
Storm will serialize the code that a Storm worker needs to execute and ship it to the worker via the network. For this
reason the code of our bolt will initialize the Meter instance during the prepare() phase of a bolt instance, which
ensures that the Meter instance is set up before the first tuples arrive at the bolt instance. So this part
achieves proper counting of the tuples.
Secondly, the prepare() method also creates a new, dedicated GraphiteReporter instance for each bolt instance. This
achieves proper reporting of metric updates to Graphite.
// BoltThatAlsoReportsToGraphite.java
package com.miguno.storm.graphitedemo;

import com.codahale.metrics.Meter;
import com.codahale.metrics.MetricFilter;
import com.codahale.metrics.MetricRegistry;
import com.codahale.metrics.graphite.Graphite;
import com.codahale.metrics.graphite.GraphiteReporter;
import org.apache.log4j.Logger;
// ...other imports such as backtype.storm.* omitted for clarity...

import java.net.InetAddress;
import java.net.UnknownHostException;
import java.util.regex.Pattern;

public class BoltThatAlsoReportsToGraphite extends BaseBasicBolt {

  private static final Logger LOG = Logger.getLogger(BoltThatAlsoReportsToGraphite.class);
  private static final String GRAPHITE_HOST = "your.graphite.server.com";
  private static final int CARBON_AGGREGATOR_LINE_RECEIVER_PORT = 2023;
  // The following value must match carbon-cache's storage-schemas.conf!
  private static final int GRAPHITE_REPORT_INTERVAL_IN_SECONDS = 10;
  private static final String GRAPHITE_METRICS_NAMESPACE_PREFIX =
    "production.apps.graphitedemo";
  private static final Pattern hostnamePattern =
    Pattern.compile("^[a-zA-Z0-9][a-zA-Z0-9-]*(\\.([a-zA-Z0-9][a-zA-Z0-9-]*))*$");

  private transient Meter tuplesReceived;

  @Override
  public void prepare(Map stormConf, TopologyContext context) {
    initializeMetricReporting();
  }

  private void initializeMetricReporting() {
    final MetricRegistry registry = new MetricRegistry();
    final Graphite graphite = new Graphite(new InetSocketAddress(GRAPHITE_HOST,
        CARBON_AGGREGATOR_LINE_RECEIVER_PORT));
    final GraphiteReporter reporter = GraphiteReporter.forRegistry(registry)
                                        .prefixedWith(metricsPath())
                                        .convertRatesTo(TimeUnit.SECONDS)
                                        .convertDurationsTo(TimeUnit.MILLISECONDS)
                                        .filter(MetricFilter.ALL)
                                        .build(graphite);
    reporter.start(GRAPHITE_REPORT_INTERVAL_IN_SECONDS, TimeUnit.SECONDS);
    tuplesReceived = registry.meter(MetricRegistry.name("tuples", "received"));
  }

  private String metricsPath() {
    final String myHostname = extractHostnameFromFQHN(detectHostname());
    return GRAPHITE_METRICS_NAMESPACE_PREFIX + "." + myHostname;
  }

  @Override
  public void execute(Tuple tuple, BasicOutputCollector collector) {
    tuplesReceived.mark();

    // FYI: We do not need to explicitly ack() the tuple because we are extending
    // BaseBasicBolt, which will automatically take care of that.
  }

  // ...other bolt code may follow here...

  //
  // Helper methods to detect the hostname of the machine that
  // executes this instance of a bolt.  Normally you'd want to
  // move this functionality into a separate class to adhere
  // to the single responsibility principle.
  //

  private static String detectHostname() {
    String hostname = "hostname-could-not-be-detected";
    try {
      hostname = InetAddress.getLocalHost().getHostName();
    }
    catch (UnknownHostException e) {
      LOG.error("Could not determine hostname");
    }
    return hostname;
  }

  private static String extractHostnameFromFQHN(String fqhn) {
    if (hostnamePattern.matcher(fqhn).matches()) {
      if (fqhn.contains(".")) {
        return fqhn.split("\\.")[0];
      }
      else {
        return fqhn;
      }
    }
    else {
      // We want to return the input as-is
      // when it is not a valid hostname/FQHN.
      return fqhn;
    }
  }

}
That’s it! Your Storm bolt instances will report their respective counts of received tuples to Graphite every 10 seconds.
Summary
At this point you should have successfully married Storm with Graphite, and also learned a few basics about how Graphite and Storm work along the way. Now you can begin creating graphs and dashboards for your Storm applications, which was the reason to do all this in the first place, right?
Enjoy!
Appendix
Where to go from here
- Want to install and configure Graphite automatically? Take a look at my puppet-graphite module for Puppet. See also my previous post on Installing and Running Graphite via RPM and Supervisord for an alternative, manual installation approach.
- Storm exposes a plethora of built-in metrics that greatly augment the application-level metrics we described in this article. In 2015 we open sourced storm-graphite, which automatically forwards these built-in metrics from Storm to Graphite. You can enable storm-graphite globally in your Storm cluster or selectively for only a subset of your topologies.
- You should start sending system metrics (CPU, memory and such) to Graphite, too. This allows you to correlate the performance of your Storm topologies with the health of the machines in the cluster. Very helpful for detecting and fixing bottlenecks! There are a couple of tools that can collect these system metrics for you and forward them to Graphite. One of those tools is Diamond. Take a look at my puppet-diamond Puppet module to automatically install and configure Diamond on your Storm cluster nodes.
- Want to install and configure Storm automatically? I am about to release an automated deployment tool called
Wirbelsturm very soon, which will allow you to deploy software such as Storm and Kafka. Wirbelsturm is essentially a
curated collection of Puppet modules (that can be used standalone, too) plus a ready-to-use
Vagrant setup to deploy machines locally and to, say, Amazon AWS.
puppet-graphiteandpuppet-diamondabove are part of the package, by the way. Please stay tuned! In the meantime my tutorial Running a Multi-Node Storm Cluster should get you started.
Caveat: Storm samples metrics for the Storm UI
If you do want to compare values 1:1 between the Storm UI and Graphite please be aware that by default Storm samples
incoming tuples for computing stats. By default it uses a sampling rate of 0.05 (5%), which is an option configurable
through Config.TOPOLOGY_STATS_SAMPLE_RATE.
The way it works is that if you choose a sampling rate of 0.05, it will pick a random element of the next 20 events in which to increase the count by 20. So if you have 20 tasks for that bolt, your stats could be off by +-380.
To force Storm to count everything exactly to achieve accurate numbers at the cost of a big performance hit to your topology you can set the sampling rate to 100%:
conf.put(Config.TOPOLOGY_STATS_SAMPLE_RATE, 1.0); // default is 0.05